
-
Capacitors
- Ceramic Capacitors
- Tantalum Capacitors
- Accessories
- Aluminum - Polymer Capacitors
- Aluminum Electrolytic Capacitors
- Capacitor Networks, Arrays
- Electric Double Layer Capacitors (EDLC), Supercapacitors
- Film Capacitors
- Mica and PTFE Capacitors
- Niobium Oxide Capacitors
- Silicon Capacitors
- Tantalum - Polymer Capacitors
- Thin Film Capacitors
- Trimmers, Variable Capacitors
-
Discrete Semiconductor Products
- Diodes - Bridge Rectifiers
- Diodes - Rectifiers - Arrays
- Diodes - Rectifiers - Single
- Diodes - RF
- Diodes - Variable Capacitance (Varicaps, Varactors)
- Diodes - Zener - Arrays
- Diodes - Zener - Single
- Power Driver Modules
- Thyristors - DIACs, SIDACs
- Thyristors - SCRs
- Thyristors - SCRs - Modules
- Thyristors - TRIACs
- Transistors - Bipolar (BJT) - Arrays
- Transistors - Bipolar (BJT) - Arrays, Pre-Biased
- Transistors - Bipolar (BJT) - RF
- Transistors - Bipolar (BJT) - Single
- Transistors - Bipolar (BJT) - Single, Pre-Biased
- Transistors - FETs, MOSFETs - Arrays
- Transistors - FETs, MOSFETs - RF
- Transistors - FETs, MOSFETs - Single
- Transistors - IGBTs - Arrays
- Transistors - IGBTs - Modules
- Transistors - IGBTs - Single
- Transistors - JFETs
- Transistors - Programmable Unijunction
- Transistors - Special Purpose
- Inductors, Coils, Chokes
-
Integrated Circuits (ICs)
- Audio Special Purpose
- Clock/Timing - Application Specific
- Clock/Timing - Clock Buffers, Drivers
- Clock/Timing - Clock Generators, PLLs, Frequency Synthesizers
- Clock/Timing - Delay Lines
- Clock/Timing - IC Batteries
- Clock/Timing - Programmable Timers and Oscillators
- Clock/Timing - Real Time Clocks
- Data Acquisition - ADCs/DACs - Special Purpose
- Data Acquisition - Analog Front End (AFE)
- Data Acquisition - Analog to Digital Converters (ADC)
- Data Acquisition - Digital Potentiometers
- Data Acquisition - Digital to Analog Converters (DAC)
- Data Acquisition - Touch Screen Controllers
- Embedded - CPLDs (Complex Programmable Logic Devices)
- Embedded - DSP (Digital Signal Processors)
- Embedded - FPGAs (Field Programmable Gate Array)
- Embedded - FPGAs (Field Programmable Gate Array) with Microcontrollers
- Embedded - Microcontroller or Microprocessor Modules
- Embedded - Microcontrollers
- Embedded - Microcontrollers - Application Specific
- Embedded - Microprocessors
- Embedded - PLDs (Programmable Logic Device)
- Embedded - System On Chip (SoC)
- Interface - Analog Switches - Special Purpose
- Interface - Analog Switches, Multiplexers, Demultiplexers
- Interface - CODECs
- Interface - Controllers
- Interface - Direct Digital Synthesis (DDS)
- Interface - Drivers, Receivers, Transceivers
- Interface - Encoders, Decoders, Converters
- Interface - Filters - Active
- Interface - I/O Expanders
- Interface - Modems - ICs and Modules
- Interface - Modules
- Interface - Sensor and Detector Interfaces
- Interface - Serializers, Deserializers
- Interface - Signal Buffers, Repeaters, Splitters
- Interface - Signal Terminators
- Interface - Specialized
- Interface - Telecom
- Interface - UARTs (Universal Asynchronous Receiver Transmitter)
- Interface - Voice Record and Playback
- Linear - Amplifiers - Audio
- Linear - Amplifiers - Instrumentation, OP Amps, Buffer Amps
- Linear - Amplifiers - Special Purpose
- Linear - Amplifiers - Video Amps and Modules
- Linear - Analog Multipliers, Dividers
- Linear - Comparators
- Linear - Video Processing
- Logic - Buffers, Drivers, Receivers, Transceivers
- Logic - Comparators
- Logic - Counters, Dividers
- Logic - FIFOs Memory
- Logic - Flip Flops
- Logic - Gates and Inverters
- Logic - Gates and Inverters - Multi-Function, Configurable
- Logic - Latches
- Logic - Multivibrators
- Logic - Parity Generators and Checkers
- Logic - Shift Registers
- Logic - Signal Switches, Multiplexers, Decoders
- Logic - Specialty Logic
- Logic - Translators, Level Shifters
- Logic - Universal Bus Functions
- Memory
- Memory - Batteries
- Memory - Configuration Proms for FPGAs
- Memory - Controllers
- PMIC - AC DC Converters, Offline Switchers
- PMIC - Battery Chargers
- PMIC - Battery Management
- PMIC - Current Regulation/Management
- PMIC - Display Drivers
- PMIC - Energy Metering
- PMIC - Full, Half-Bridge Drivers
- PMIC - Gate Drivers
- PMIC - Hot Swap Controllers
- PMIC - Laser Drivers
- PMIC - LED Drivers
- PMIC - Lighting, Ballast Controllers
- PMIC - Motor Drivers, Controllers
- PMIC - OR Controllers, Ideal Diodes
- PMIC - PFC (Power Factor Correction)
- PMIC - Power Distribution Switches, Load Drivers
- PMIC - Power Management - Specialized
- PMIC - Power Over Ethernet (PoE) Controllers
- PMIC - Power Supply Controllers, Monitors
- PMIC - RMS to DC Converters
- PMIC - Supervisors
- PMIC - Thermal Management
- PMIC - V/F and F/V Converters
- PMIC - Voltage Reference
- PMIC - Voltage Regulators - DC DC Switching Controllers
- PMIC - Voltage Regulators - DC DC Switching Regulators
- PMIC - Voltage Regulators - Linear
- PMIC - Voltage Regulators - Linear + Switching
- PMIC - Voltage Regulators - Linear Regulator Controllers
- PMIC - Voltage Regulators - Special Purpose
- Specialized ICs
- Isolators
- Relays
-
RF/IF and RFID
- Attenuators
- Balun
- RF Accessories
- RF Amplifiers
- RF Antennas
- RF Demodulators
- RF Detectors
- RF Diplexers
- RF Directional Coupler
- RF Evaluation and Development Kits, Boards
- RF Front End (LNA + PA)
- RF Misc ICs and Modules
- RF Mixers
- RF Modulators
- RF Power Controller ICs
- RF Power Dividers/Splitters
- RF Receiver, Transmitter, and Transceiver Finished Units
- RF Receivers
- RF Shields
- RF Switches
- RF Transceiver ICs
- RF Transceiver Modules
- RF Transmitters
- RFI and EMI - Contacts, Fingerstock and Gaskets
- RFI and EMI - Shielding and Absorbing Materials
- RFID Accessories
- RFID Antennas
- RFID Evaluation and Development Kits, Boards
- RFID Reader Modules
- RFID Transponders, Tags
- RFID, RF Access, Monitoring ICs
- RF Circulators and Isolators
-
Sensors, Transducers
- Accessories
- Amplifiers
- Capacitive Touch Sensors, Proximity Sensor ICs
- Color Sensors
- Current Transducers
- Dust Sensors
- Encoders
- Flex Sensors
- Float, Level Sensors
- Flow Sensors
- Force Sensors
- Gas Sensors
- Humidity, Moisture Sensors
- Image Sensors, Camera
- IrDA Transceiver Modules
- Magnetic Sensors - Compass, Magnetic Field (Modules)
- Magnetic Sensors - Linear, Compass (ICs)
- Magnetic Sensors - Position, Proximity, Speed (Modules)
- Magnetic Sensors - Switches (Solid State)
- Magnets - Multi Purpose
- Magnets - Sensor Matched
- Motion Sensors - Accelerometers
- Motion Sensors - Gyroscopes
- Motion Sensors - IMUs (Inertial Measurement Units)
- Motion Sensors - Inclinometers
- Motion Sensors - Optical
- Motion Sensors - Tilt Switches
- Motion Sensors - Vibration
- Multifunction
- Optical Sensors - Ambient Light, IR, UV Sensors
- Optical Sensors - Distance Measuring
- Optical Sensors - Mouse
- Optical Sensors - Photo Detectors - CdS Cells
- Optical Sensors - Photo Detectors - Logic Output
- Optical Sensors - Photo Detectors - Remote Receiver
- Optical Sensors - Photodiodes
- Optical Sensors - Photoelectric, Industrial
- Optical Sensors - Photointerrupters - Slot Type - Logic Output
- Optical Sensors - Photointerrupters - Slot Type - Transistor Output
- Optical Sensors - Phototransistors
- Optical Sensors - Reflective - Analog Output
- Optical Sensors - Reflective - Logic Output
- Position Sensors - Angle, Linear Position Measuring
- Pressure Sensors, Transducers
- Proximity Sensors
- Proximity/Occupancy Sensors - Finished Units
- Sensor Cable - Accessories
- Sensor Cable - Assemblies
- Sensor Interface - Junction Blocks
- Shock Sensors
- Solar Cells
- Specialized Sensors
- Strain Gauges
- Temperature Sensors - Analog and Digital Output
- Temperature Sensors - NTC Thermistors
- Temperature Sensors - PTC Thermistors
- Temperature Sensors - RTD (Resistance Temperature Detector)
- Temperature Sensors - Thermocouple, Temperature Probes
- Temperature Sensors - Thermostats - Mechanical
- Temperature Sensors - Thermostats - Solid State
- Ultrasonic Receivers, Transmitters
- Camera Modules
- LVDT Transducers (Linear Variable Differential Transformer)
- Optical Sensors - Photonics - Counters, Detectors, SPCM (Single Photon Counting Module)
- Touch Sensors
-
Circuit Protection
- Accessories
- Circuit Breakers
- Electrical, Specialty Fuses
- Fuseholders
- Fuses
- Gas Discharge Tube Arresters (GDT)
- Ground Fault Circuit Interrupter (GFCI)
- Inrush Current Limiters (ICL)
- Lighting Protection
- PTC Resettable Fuses
- Surge Suppression ICs
- TVS - Diodes
- TVS - Mixed Technology
- TVS - Surge Protection Devices (SPDs)
- TVS - Thyristors
- TVS - Varistors, MOVs
- Thermal Cutoffs (Thermal Fuses)
-
Connectors, Interconnects
- Backplane Connectors - ARINC Inserts
- Backplane Connectors - ARINC
- Backplane Connectors - Accessories
- Backplane Connectors - Contacts
- Backplane Connectors - DIN 41612
- Backplane Connectors - Hard Metric, Standard
- Backplane Connectors - Housings
- Backplane Connectors - Specialized
- Banana and Tip Connectors - Accessories
- Banana and Tip Connectors - Adapters
- Banana and Tip Connectors - Binding Posts
- Banana and Tip Connectors - Jacks, Plugs
- Barrel - Accessories
- Barrel - Adapters
- Barrel - Audio Connectors
- Barrel - Power Connectors
- Between Series Adapters
- Blade Type Power Connectors - Accessories
- Blade Type Power Connectors - Contacts
- Blade Type Power Connectors - Housings
- Blade Type Power Connectors
- Card Edge Connectors - Accessories
- Card Edge Connectors - Adapters
- Card Edge Connectors - Contacts
- Card Edge Connectors - Edgeboard Connectors
- Card Edge Connectors - Housings
- Circular Connectors - Accessories
- Circular Connectors - Adapters
- Circular Connectors - Backshells and Cable Clamps
- Circular Connectors - Contacts
- Circular Connectors - Housings
- Circular Connectors
- Coaxial Connectors (RF) - Accessories
- Coaxial Connectors (RF) - Adapters
- Coaxial Connectors (RF) - Contacts
- Coaxial Connectors (RF) - Terminators
- Coaxial Connectors (RF)
- Contacts - Leadframe
- Contacts - Multi Purpose
- Contacts, Spring Loaded (Pogo Pins), and Pressure
- D-Shaped Connectors - Centronics
- D-Sub Connectors
- D-Sub, D-Shaped Connectors - Accessories - Jackscrews
- D-Sub, D-Shaped Connectors - Accessories
- D-Sub, D-Shaped Connectors - Adapters
- D-Sub, D-Shaped Connectors - Backshells, Hoods
- D-Sub, D-Shaped Connectors - Contacts
- D-Sub, D-Shaped Connectors - Housings
- D-Sub, D-Shaped Connectors - Terminators
- FFC, FPC (Flat Flexible) Connectors - Accessories
- FFC, FPC (Flat Flexible) Connectors - Contacts
- FFC, FPC (Flat Flexible) Connectors - Housings
- FFC, FPC (Flat Flexible) Connectors
- Fiber Optic Connectors - Accessories
- Fiber Optic Connectors - Adapters
- Fiber Optic Connectors - Housings
- Fiber Optic Connectors
- Heavy Duty Connectors - Accessories
- Heavy Duty Connectors - Assemblies
- Heavy Duty Connectors - Contacts
- Heavy Duty Connectors - Frames
- Heavy Duty Connectors - Housings, Hoods, Bases
- Heavy Duty Connectors - Inserts, Modules
- Keystone - Accessories
- Keystone - Faceplates, Frames
- Keystone - Inserts
- LGH Connectors
- Memory Connectors - Accessories
- Memory Connectors - Inline Module Sockets
- Memory Connectors - PC Card Sockets
- Memory Connectors - PC Cards - Adapters
- Modular Connectors - Accessories
- Modular Connectors - Adapters
- Modular Connectors - Jacks With Magnetics
- Modular Connectors - Jacks
- Modular Connectors - Plug Housings
- Modular Connectors - Plugs
- Modular Connectors - Wiring Blocks - Accessories
- Modular Connectors - Wiring Blocks
- Photovoltaic (Solar Panel) Connectors - Accessories
- Photovoltaic (Solar Panel) Connectors - Contacts
- Photovoltaic (Solar Panel) Connectors
- Pluggable Connectors - Accessories
- Pluggable Connectors
- Power Entry Connectors - Accessories
- Power Entry Connectors - Inlets, Outlets, Modules
- Rectangular Connectors - Accessories
- Rectangular Connectors - Adapters
- Rectangular Connectors - Arrays, Edge Type, Mezzanine (Board to Board)
- Rectangular Connectors - Board In, Direct Wire to Board
- Rectangular Connectors - Board Spacers, Stackers (Board to Board)
- Rectangular Connectors - Contacts
- Rectangular Connectors - Free Hanging, Panel Mount
- Rectangular Connectors - Headers, Male Pins
- Rectangular Connectors - Headers, Receptacles, Female Sockets
- Rectangular Connectors - Headers, Specialty Pin
- Rectangular Connectors - Housings
- Rectangular Connectors - Spring Loaded
- Shunts, Jumpers
- Sockets for ICs, Transistors - Accessories
- Sockets for ICs, Transistors - Adapters
- Sockets for ICs, Transistors
- Solid State Lighting Connectors - Accessories
- Solid State Lighting Connectors - Contacts
- Solid State Lighting Connectors
- Terminal Blocks - Accessories - Jumpers
- Terminal Blocks - Accessories - Marker Strips
- Terminal Blocks - Accessories - Wire Ferrules
- Terminal Blocks - Accessories
- Terminal Blocks - Adapters
- Terminal Blocks - Barrier Blocks
- Terminal Blocks - Contacts
- Terminal Blocks - Din Rail, Channel
- Terminal Blocks - Headers, Plugs and Sockets
- Terminal Blocks - Interface Modules
- Terminal Blocks - Panel Mount
- Terminal Blocks - Power Distribution
- Terminal Blocks - Specialized
- Terminal Blocks - Wire to Board
- Terminal Junction Systems
- Terminal Strips and Turret Boards
- Terminals - Accessories
- Terminals - Adapters
- Terminals - Barrel, Bullet Connectors
- Terminals - Foil Connectors
- Terminals - Housings, Boots
- Terminals - Knife Connectors
- Terminals - Magnetic Wire Connectors
- Terminals - PC Pin Receptacles, Socket Connectors
- Terminals - PC Pin, Single Post Connectors
- Terminals - Quick Connects, Quick Disconnect Connectors
- Terminals - Rectangular Connectors
- Terminals - Ring Connectors
- Terminals - Screw Connectors
- Terminals - Solder Lug Connectors
- Terminals - Spade Connectors
- Terminals - Specialized Connectors
- Terminals - Turret Connectors
- Terminals - Wire Pin Connectors
- Terminals - Wire Splice Connectors
- Terminals - Wire to Board Connectors
- USB, DVI, HDMI Connectors - Accessories
- USB, DVI, HDMI Connectors - Adapters
- USB, DVI, HDMI Connectors
- Crystals, Oscillators, Resonators
-
Development Boards, Kits, Programmers
- Accessories
- Evaluation Boards - Analog to Digital Converters (ADCs)
- Evaluation Boards - Audio Amplifiers
- Evaluation Boards - DC/DC & AC/DC (Off-Line) SMPS
- Evaluation Boards - Digital to Analog Converters (DACs)
- Evaluation Boards - Embedded - Complex Logic (FPGA, CPLD)
- Evaluation Boards - Embedded - MCU, DSP
- Evaluation Boards - Expansion Boards, Daughter Cards
- Evaluation Boards - LED Drivers
- Evaluation Boards - Linear Voltage Regulators
- Evaluation Boards - Op Amps
- Evaluation Boards - Sensors
- Evaluation and Demonstration Boards and Kits
- Programmers, Emulators, and Debuggers
- Programming Adapters, Sockets
- Software, Services
- UV Erasers
- Filters
- Memory Cards, Modules
- Potentiometers, Variable Resistors
- Power Supplies - Board Mount
- Power Supplies - External/Internal (Off-Board)
- Resistors
Adding Relative Strength to Value | BinaryFest.com
Recently, a reader made a comment on one of our articles about value stocks. The reader agreed that the stocks sounded like good investment opportunities but wondered when the stocks were likely to move. To answer that question, we need to look beyond value. Another investment tool, relative strength (RS), is better suited for that answer.
RS is a term used by technical analysts. It is a measure of comparative performance. In other words, RS answers the question of whether or not a stock or an ETF is outperforming the market. If the stock is beating the market, it is said to have high RS. A stock whose price action is lagging or underperforming the market is said to have low RS.
In the academic community, RS is called momentum, a subject that has been widely studied. The conclusion is that stocks with strong momentum tend to outperform the market. The studies measure momentum over periods of 3 to 12 months and found any time within that window works.

The chart below, from Dr. Kenneth French of Dartmouth College, is an example of the research. This chart shows the performance of small and big cap stocks segmented by momentum. “Small Hi” shows small cap stocks with high momentum. From 1927 to 1999, this group delivered the best gains.

Calculating momentum is fairly straightforward. For example, if a stock has outperformed the market over the past six months it is likely to outperform in the next six months. This won’t always work. But, in the long run, an investor should expect to beat the market by investing in high RS stocks.
The problem is these tend to be the stocks that decline the most in a market downturn. Momentum investors can experience large losses for extended periods of time. To minimize those risks, some analysts suggest combining value and momentum.
From Theory to Practice
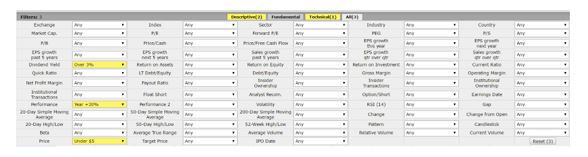
We followed that approach in creating this week’s screen. We combined income, low price and RS. WE used the free screening tool at FinViz.com to find stocks with dividend yields of at least 3%, priced under $5 and a 52-week return of at least 30% which is a larger return than the S&P 500.
We included an income requirement to add to the potential returns of the strategy and to cushion the downside. Even if a bear market develops, dividends provide some level of return even as prices decline.
The stocks that passed, using the FinViz.com data, are:
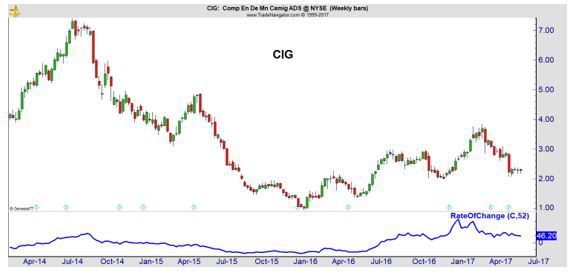
- Companhia Energética de Minas Gerais (NYSE: CIG) engages in the generation, transmission, distribution, and sale of electricity in Brazil. The company generates electricity through renewable energy sources. The company operates hydroelectric plants, thermoelectric plants, and solar plants with a total installed capacity of approximately 8,000 megawatts in 10 states of Brazil.. It is also involved in the telecommunications and energy solutions consulting businesses; exploitation of natural gas; sale and trading of electricity; and acquisition, transport, and distribution of gas and its subproducts and derivatives, as well as provision of technology systems and systems for operational management of public service concessions, including companies operating in electricity, gas, water and sewerage, and other utility companies.
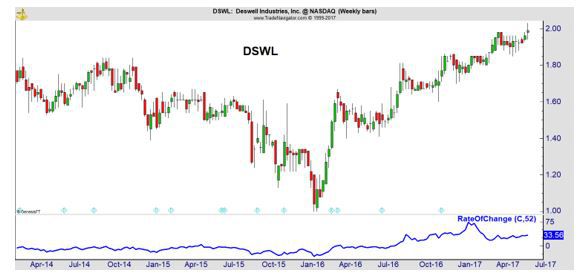
- Deswell Industries, Inc. (Nasdaq: DSWL) manufactures and sells injection-molded plastic parts and components; and assembles electronic products for original equipment manufacturers and contract manufacturers. The company produces plastic parts and components that are used in the manufacture of consumer and industrial products, which include plastic components of electronic entertainment products. Some of these products include, cases for flashlights, telephones, paging machines, projectors, and alarm clocks; toner cartridges and cases for photocopy and printer machines.
- Institutional Financial Markets, Inc. (NYSE: IFMI) is a publicly owned investment manager focusing on separate client-focused fixed income portfolios. The company also manages funds and collateralized debt obligations for its clients. It invests in the fixed income and alternative investment markets across the globe. The firm’s fixed income investments include U.S. trust preferred securities, European hybrid capital securities, Asian commercial real estate debt, mortgage backed securities, and asset backed securities.
- National American University Holdings, Inc. (Nasdaq: NAUH) owns and operates National American University (NAU) that provides postsecondary education services primarily for working adults and other non-traditional students in the United States. The company offers associate, bachelor’s, master’s, and doctoral degree and diploma programs in business-related disciplines, such as accounting, applied management, business administration, and information technology; and in healthcare-related disciplines, including nursing and healthcare management. The company also provides courseware development, technical support, and online class hosting services to various colleges, technical schools, and training institutions in the United States and Canada.
- Taitron Components Incorporated (Nasdaq: TAIT) supplies original designed and manufactured (ODM) electronic components, and distribution of brand name electronic components. It distributes discrete semiconductors, commodity integrated circuits, optoelectronic devices, and passive components. The company also provides value-added engineering and turn-key services focusing on providing contract electronic manufacturers (CEMs) and original equipment manufacturers (OEMs) with ODM services for their turn-key projects. It serves other electronic distributors, CEMs, and OEMs in the United States, Mexico, Brazil, Taiwan, China, Canada, and internationally.
- VOC Energy Trust (NYSE: VOC) acquires and holds a term net profits interest of the net proceeds from production and sale of the interests in oil and natural gas properties in the states of Kansas and Texas. The company has 80% term net profits interest of the net proceeds on the underlying properties. In 2016, its underlying properties had interests in 496.6 net producing wells and 55,851.6 net acres; and had proved reserves of approximately 3.2 million barrels of oil equivalent (MMBoe) attributable to the portion of the Kansas underlying properties, and approximately 5.1 MMBoe attributable to the Texas underlying properties.
Remember, There Are Risks
The fact that they all have high RS indicates they are likely to beat the market over the next year. However, these are also the types of stocks that can sell off sharply on bad news. The news could be a disappointing earnings report or even bad news within the stock’s sector.
The risk means it could be best to trade a basket of high RS stocks. With that strategy, a sell off in one stock will have less impact on the portfolio. The studies which demonstrate the success of momentum strategies are all based on the performance of a portfolio rather than just one individual stocks.
It’s also important to note some high RS stocks will be in pullbacks. This is the case with CIG.
Other high RS stocks will be in strong up trends. This is the case for DSWL.
Some investors are uncomfortable buying new highs and they may prefer to create a portfolio of high RS stocks in pullbacks. Other investors may decide it is better to buy new highs since those are stocks in confirmed up trends.
These charts illustrate the fact that even though RS is a quantitative tool, there is room to create a strategy that accommodates your risk profile. That is important to consider since you should only trade a strategy with a risk profile that is comfortable for you.
If you cannot accept the risk of any strategy, you are likely to give up on that strategy at the worst possible time, which is when the strategy is in a drawdown. With momentum strategies, you should expect the worst drawdowns to be larger than the decline in the S&P 500.
Despite the large drawdowns, in the long run, these strategies have been proven to work. You may find, as many others have, that momentum could be the key to unlocking short-term gains in a value strategy.
Related Posts
.jpg)

Comments (4)
-
 Jessica MooreThis article about electronic components is well-written and informative. It covers a wide range of topics and provides valuable insights into the world of electronics. I found the explanations to be clear and easy to understand, even for someone with limited technical knowledge.November 30, 2019
-
 Adam TaylorI also enjoyed reading this article. It's great to see such clear explanations of complex topics. Looking forward to reading more from this author in the future.December 5, 2019
-
-
 Ryan FordI completely agree with the previous reviewer. This article is an excellent resource for anyone interested in learning about electronic components. I particularly appreciated the section on common types of resistors and how to read their values. Keep up the good work!December 5, 2020
Write A Comment
Popular News
-
Vishay Intertechnology, Inc. (NYSE:VSH) has been assigned a consensus rating of ...Jul 13, 2017
-
Vishay Intertechnology, a Rare Tech Stock on SaleThe valuation of technology sto...Apr 24, 2017
-
Digital and memory ICs constitute about two-thirds of today's roughly $320 billi...Jul 14, 2017
-
Integrated Circuit,Diodes, Transistors,Semiconductors,Capacitance,resistance,Tan...Sep 5, 2017
-
HELLA Aglaia and NXP open visual platform for automated driving safety....Sep 13, 2017